
This week’s Tweetchat is kindly hosted by Alex Spiers and Tünde Varga-Atkins.

Alex Spiers
Alex is a Learning Technology Developer in the eLearning Unit at the University of Liverpool with over 12 years experience working in the learning technology field. He is the coordinator of the ALT North West England SIG which is a network that brings together learning technologists with the aim of supporting the informed use of learning technologies in the region. He is also a member of MELSIG (Media Enhanced Learning SIG) organising group having presented and supported a range of events since 2008. His areas of interest include the use of social media to support authentic learning and develop digital literacies. He is also passionate about the use of personalised mobile devices to support learning and has co-facilitated the Bring Your Own Devices for Learning open online course for the past two years. He studied History of Art at the University of Glasgow and is a regular contributor to the music and art scene in Liverpool.

Tünde Varga-Atkin
Tünde is a Learning Technology Developer and researcher at the eLearning Unit, University of Liverpool, developing a specialism in TEL (technology-enhanced learning) research and evaluation. She co-facilitates TEL Research @Liverpool which is aimed at building capacity around TEL research within the institution and also co-convenes a regional research group, ELESIG NW with colleagues from Manchester and LJMU. Her specific areas of interest include learner experiences of e-learning and the development of digital literacies. Her interest in visual research methods all feature in her research and evaluation work. She is currently studying on Lancaster University’s E-research and Technology-Enhanced Learning PhD programme, and embarking on a thesis that would like to focus on exploring the use of visualisation of TEL research activity to benefit organisational learning.
Tweetchat (Weds, 1st February)
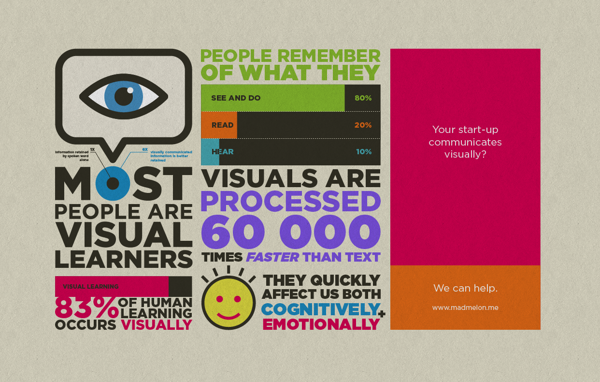
What do you see? Using visual media to communicate our teaching and research
Taking up the baton of ‘seeing’ from last week’s #LTHEchat on park running and teaching on “Excellence…I know it when I see it”, we will share ideas this week on using visual media to communicate our teaching and scholarship.
You know this quote is coming: yes, a “picture paints a 1000 words”! Why is this the case?
http://themesdojo.com/metro/wp-content/uploads/portfolio14.png
What do we mean by visual media? There are certain ways of thinking about visuals: they can be ‘found’ or created images – although nowadays this binary has become quite blurred. Banks (2001) distinguishes a verbal-visual spectrum, placing words and text on one end and images (photos, drawings) at the other end. Diagrams, for instance, are somewhere in-between, contain both textual and visual information. We have lots of sub-genres of visuals like maps, mind-maps, concept-maps. Then we have static and moving images!
Certain disciplines have special relationships with visuals. Art historians, archaeologists will be immersed in visual imagery of paintings, photos, drawings, sketches – visual representations of artefacts. Engineers and designers will be conversant with diagrams, 2D and 3D representations of spaces and objects. English and other writers will be fond of typography. Marketing and social media experts will be apt observers of how visual communication channels and artefacts work in different cultural contexts. What about when it comes to our teaching practice? Do we have the same relationship to visual communication as we do in our respective disciplines? Are we making best use of this mode of communication for meaning-making and learning (and helping others to learn)?
How? What works? What doesn’t? Have you got any practical tips for tools to use that help you creating – or finding – visual artefacts?
Are pictures ‘just’ for illustration? (Madeleine Hallewell and Natasa Lackovic conducted a really interesting piece of research into the use of images within powerpoint slides in psychology lectures) Do you use them for learning and meaning-making? There is a whole body of literature on multimodality in social semiotics (Kress, Jewitt). This is concerned with different (hence multi) resources, or modes, that can be used for meaning-making. Examples modes are:
-
Written text
-
Spoken word
-
Audio
-
Visuals
-
Kinetics e.g. TOUCH etc.
What they argue, or interested in, is how the different modes can interact to create or enhance meaning, or when traversing between different modes, how different insights can be created during such a conversion process. You have all probably experienced how putting together a presentation slide or a poster of an academic article helped crystallise salient points – due to the fact that content or findings had to be converted and communicated in a visual form.
In preparation for this week’s #LTHEchat, we would love you to reflect on what visuals you work with, and how you use them in your teaching. We hope to share ideas, experiences or learning tasks in which you ask students to draw on the visual mode to help access, communicate their learning or leading them to insights in different (visual) ways.
See you soon!
Alex and Tunde
The Storify for #LTHEchat 74 can be found here.
References
Banks, Marcus. 2001. Visual methods in social research. London: Sage.
Hallewell, Madeline Jennifer (2013) Creatively re-mediating the integration of visual resources with spoken expositions during slideshows in undergraduate psychology lectures. PhD thesis, University of Nottingham. http://eprints.nottingham.ac.uk/14044/
Lackovic, Natasa. 2010. Creating and reading images: towards a communication framework for Higher Education learning. Seminar.net – International journal of media, technology and lifelong learning Vol. 6 – Issue 1 – 2010 http://eprints.lancs.ac.uk/70856/1/Lakovic.pdf


Great post. Keep posting such kind of info on your page. Am really impressed by your blog.
LikeLike